Difference estimation is a classical variables sampling (CVS) method that uses the average difference between the audited and recorded amounts in the sample to estimate the total audited value (or the total misstatement) of a population.
CVS uses the normal distribution theory, standard deviation and confidence interval to evaluate the characteristics of a population.
Stratified Sample Size
Stratification of the population to determine the optimal strata boundaries and the use of the difference estimator results in a very efficient sample size (much smaller than other unstratified methods).
To determine the sample size the auditor has to estimate the proportion of error in the population. An estimate of the proportion of misstatement is determined based on past operating history, previous test results or a walk-through test. A higher error rate will produce larger sample sizes (e.g. above 2%). The sample size is allocated to the strata using either the optimal (Neyman) allocation or proportional to the total amount within the stratum.
To calculate the sample size, the inputs required are:
- Population Value: book value or monetary value of the population.
- Population Size: total number of items in the population.
- Number of Strata: number of intervals for the stratification.
- Number of Cells: number of cells used for preliminary stratification.
- Confidence Level: level of confidence that the sample estimate is accurate (1 – alpha risk of incorrect rejection). High (90-95%), moderate (80%).
- Power: statistical power of the test to detect a significant difference (1 – beta risk of incorrect acceptance). High (90-95%), moderate (80-86%), low (50-75%).
- Estimation Method: Sample size estimator (difference, ratio or mean-per-unit estimation).
- 1 or 2-sided Interval: 1 or 2-sided confidence interval (lower/upper tails).
- Expected Misstatement %: estimated proportion of misstatement in the population.
- Tolerable Misstatement: maximum acceptable amount of misstatement in the population.
- Ratio P/T: ratio of precision to tolerable misstatement related to alpha and beta risks (P/T = zα / zα + zβ)1,2.
- Precision: allowance for sampling risk (P/T * tolerable misstatement).
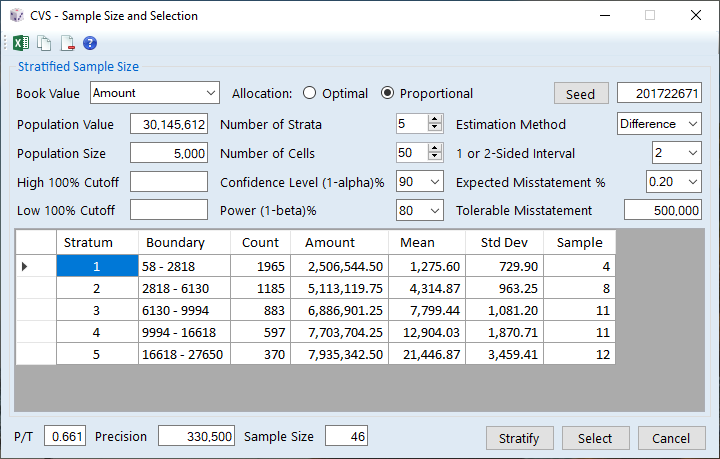
Example:
Number of Strata: 5
Number of Cells: 50
Confidence Level (1 – Alpha): 90%
Power (1 – Beta): 80%
1 or 2-sided Interval: 2
Expected Misstatement Rate: 0.20%
Tolerable Misstatement: 500000
Sample Size: 46
Allocation: Optimal

The sample size is allocated in proportion to the stratum size and standard deviation (Count * Std Dev). A larger sample size is allocated to the larger and more variable stratum. This method also produces nearly equal stratum sample sizes.
Allocation: Proportional
The sample size is allocated in proportion to the stratum total amount value. A larger sample size is allocated to the stratum if the total amount is higher.
Selection of Sample Items
The sampling unit is each item or record in the population. Samples are selected randomly from each stratum based on a random seed (stratified random selection).
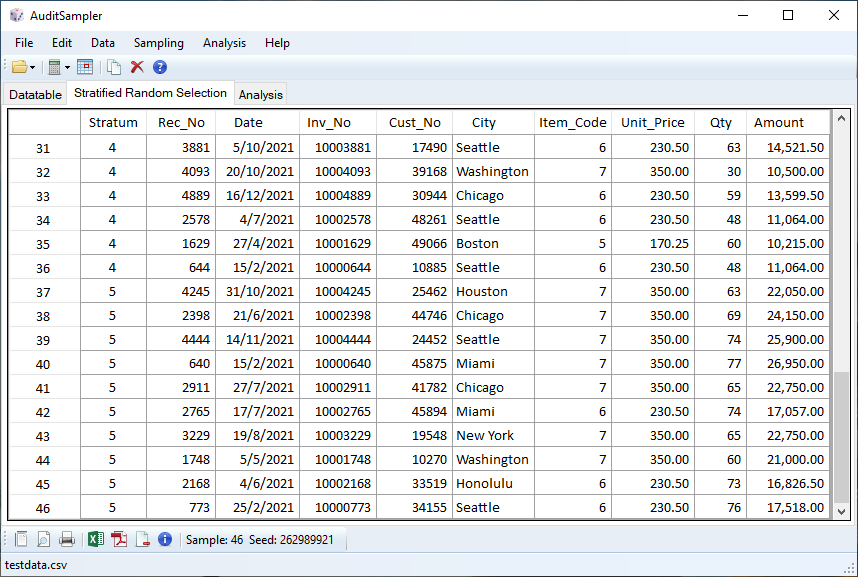
* Random selection based on optimum allocation (no duplicates).
Evaluation of Sample Results

The sample mean difference is used to compute the sample estimate for each stratum and the point estimate for the total “audited amount” and “misstatement”.
- Point Estimate (audited amount) = population value (PV) + sample estimate.
- Point Estimate (misstatement) = sample estimate.
The precision or allowance for sampling risk is the standard error multiplied by the T-value for the desired confidence level (1 – risk of incorrect acceptance). The precision interval ranges from the lower precision limit to the upper precision limit.
- Lower Precision Limit (LL) = point estimate – precision.
- Upper Precision Limit (UL) = point estimate + precision.
The sample results are evaluated by determining if the population value falls within the “audited amount” precision interval or the “misstatement” lower and upper limits are not greater than tolerable misstatement:
- Audited Amount: LL ≤ PV ≤ UL, the account is likely fairly stated;
- Misstatement: LL and UL ≤ TM, the account is not materially misstated;
- Misstatement: LL or UL > TM, the account is materially misstated.
Based on the evaluation, the population value ($30,145,613) falls within the audited amount precision limits and the misstatement lower/upper limits are less than tolerable misstatement ($500,000). The account is likely fairly stated.
References
- Donald M. Roberts (1978), Statistical Auditing, New York: American Institute of Certified Public Accountants.
- Trevor R. Stewart (2012), Technical Notes on the AICPA Audit Guide: Audit Sampling, New York: American Institute of Certified Public Accountants.
- Robert K. Elliot and John R. Rogers (1972), Relating Statistical Sampling to Audit Objectives, Journal of Accountancy. https://raw.rutgers.edu/docs/Elliott/30relatingststsampling.pdf
- AICPA (2014), Appendix D: Ratio of Desired Allowance for Sampling Risk of Incorrect Rejection to Tolerable Misstatement, Audit Guide: Audit Sampling (First Edition), New York: John Wiley & Sons, Inc. https://onlinelibrary.wiley.com/doi/10.1002/9781119448617.app4